

A data scientist for every decision.
Drop in a CSV or CRM export and the Data & Analytics Hive turns it into the answer — retention and churn, cohorts and LTV, revenue movement, forecasts, and executive KPIs — as an interactive dashboard you can act on, every number queried from your data.
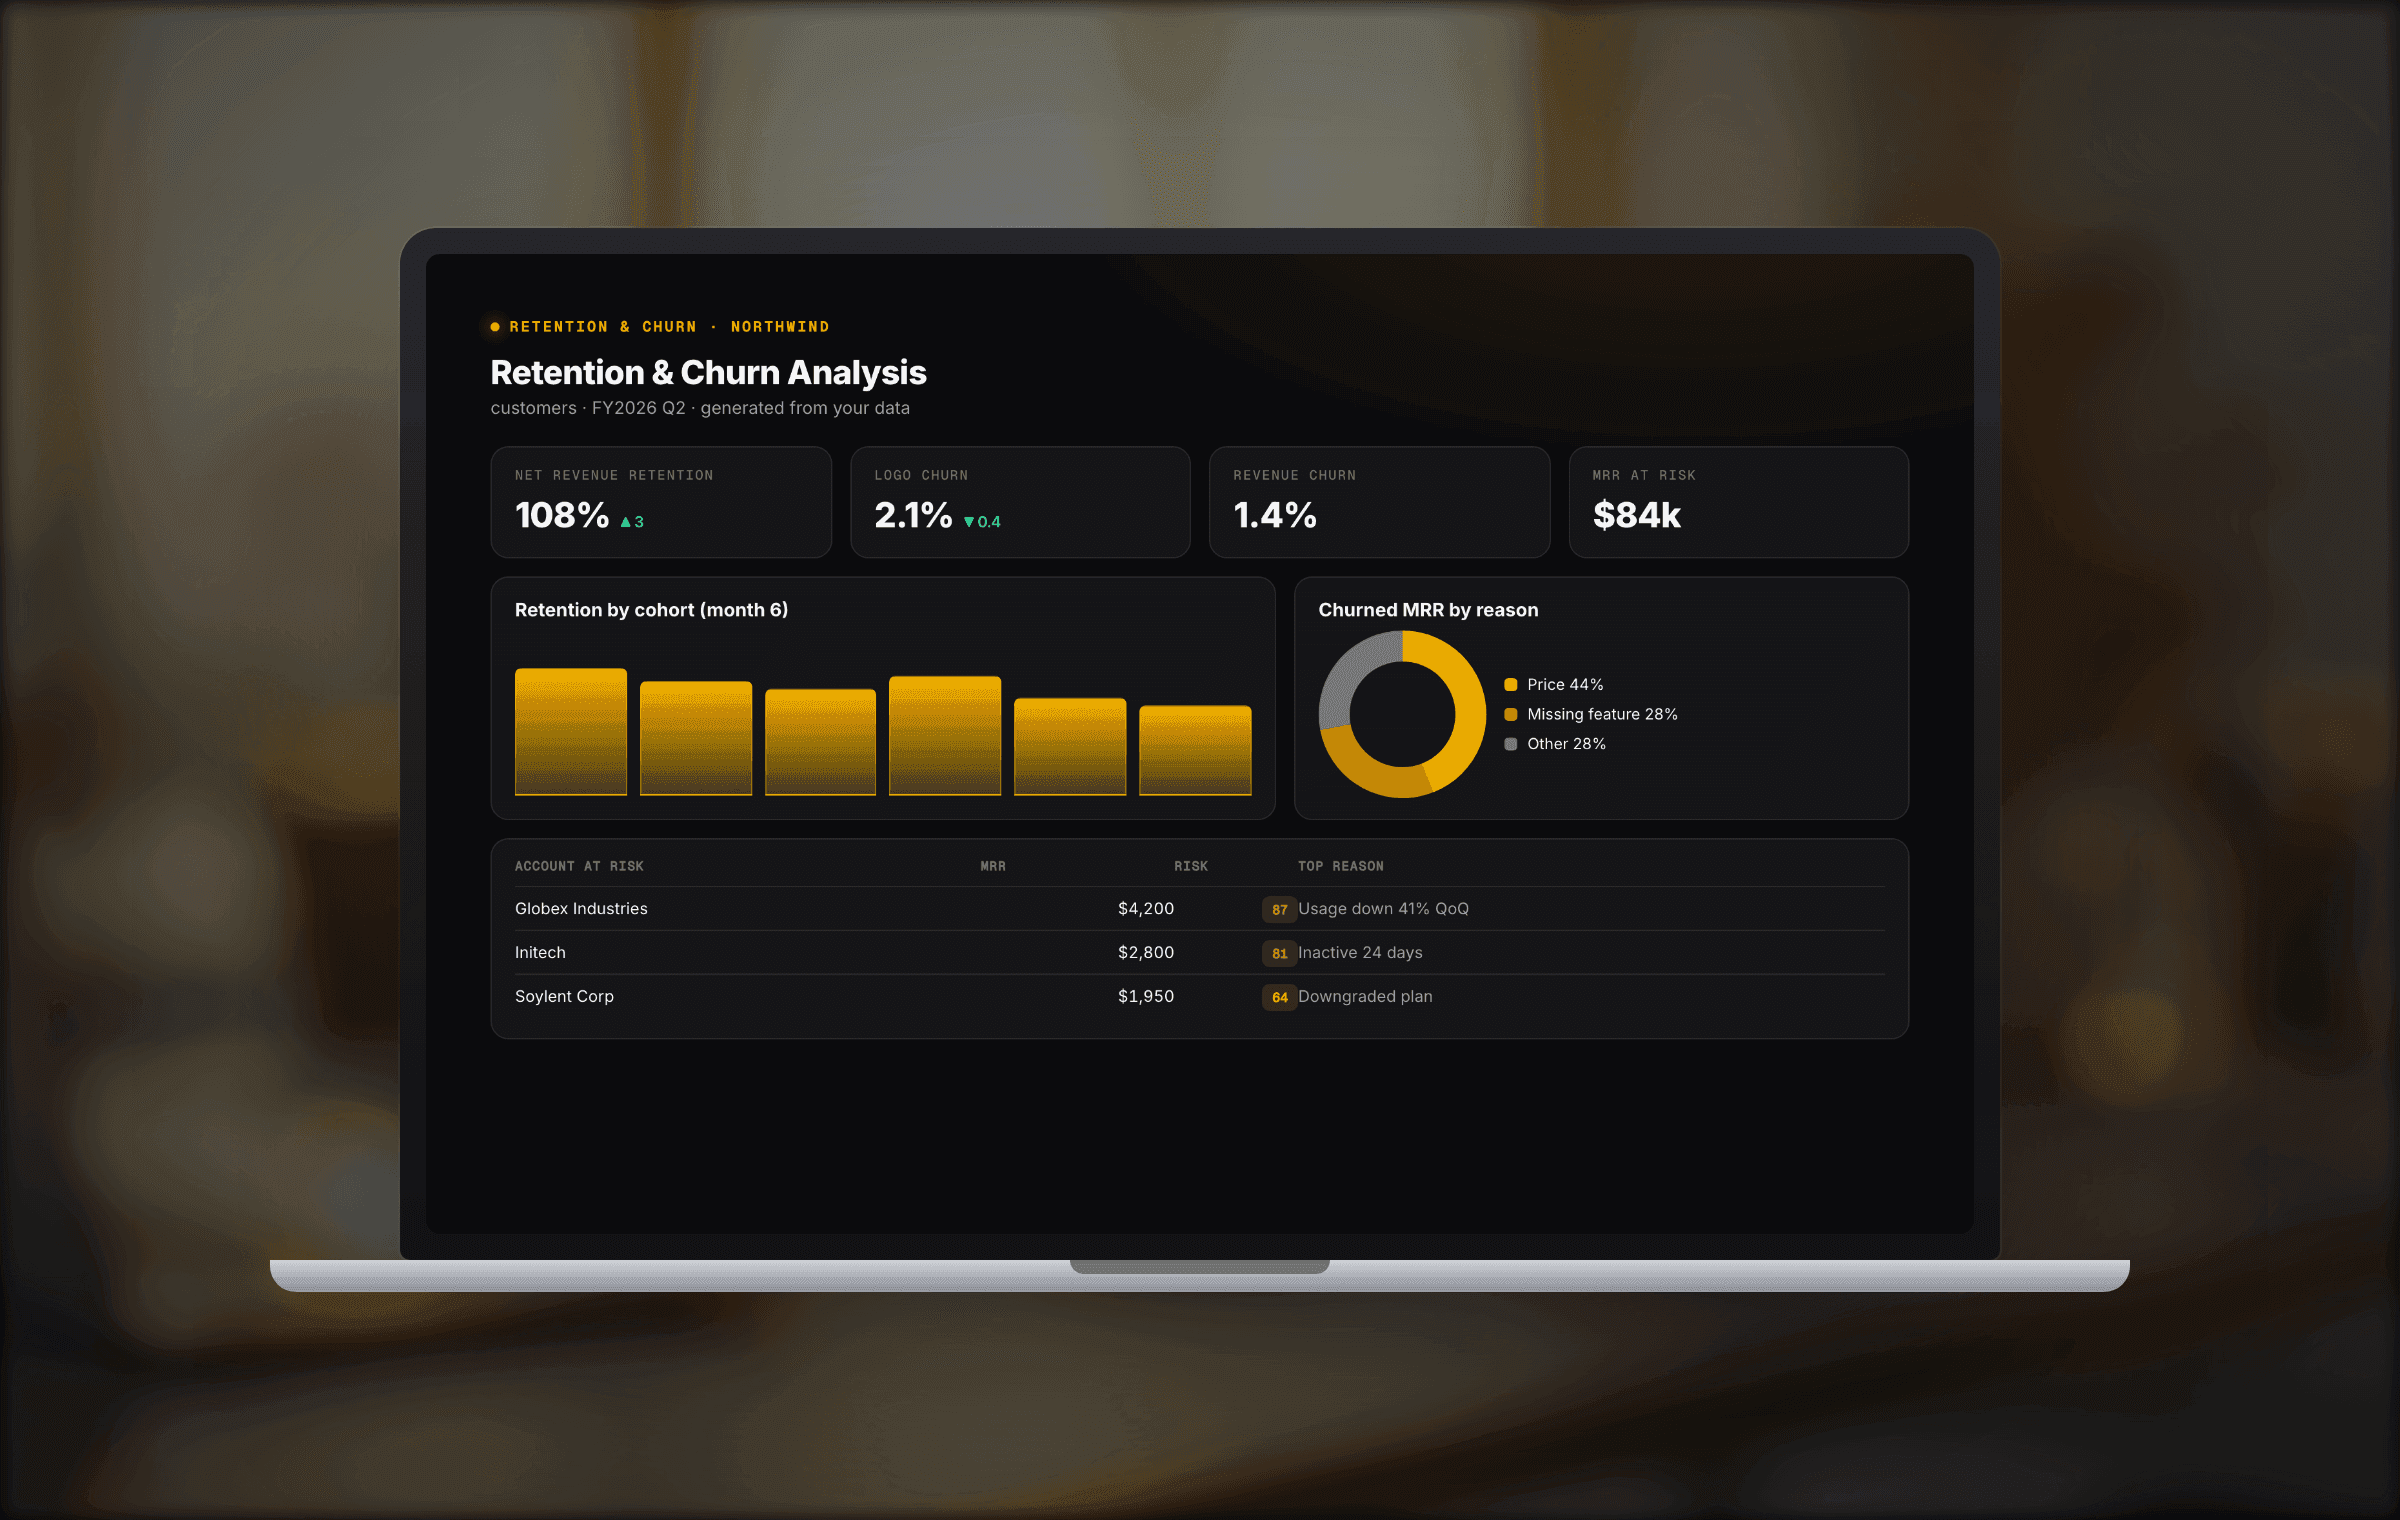
Retention & churn from your data — NRR, the drivers, and a ranked list of accounts to save — as a live dashboard.
Revenue & retention
Know who stays, who pays, and why.
Churn drivers and at-risk accounts, MRR movement and NRR, cohort curves and LTV, funnel drop-off — each computed from your data and delivered as an interactive dashboard.
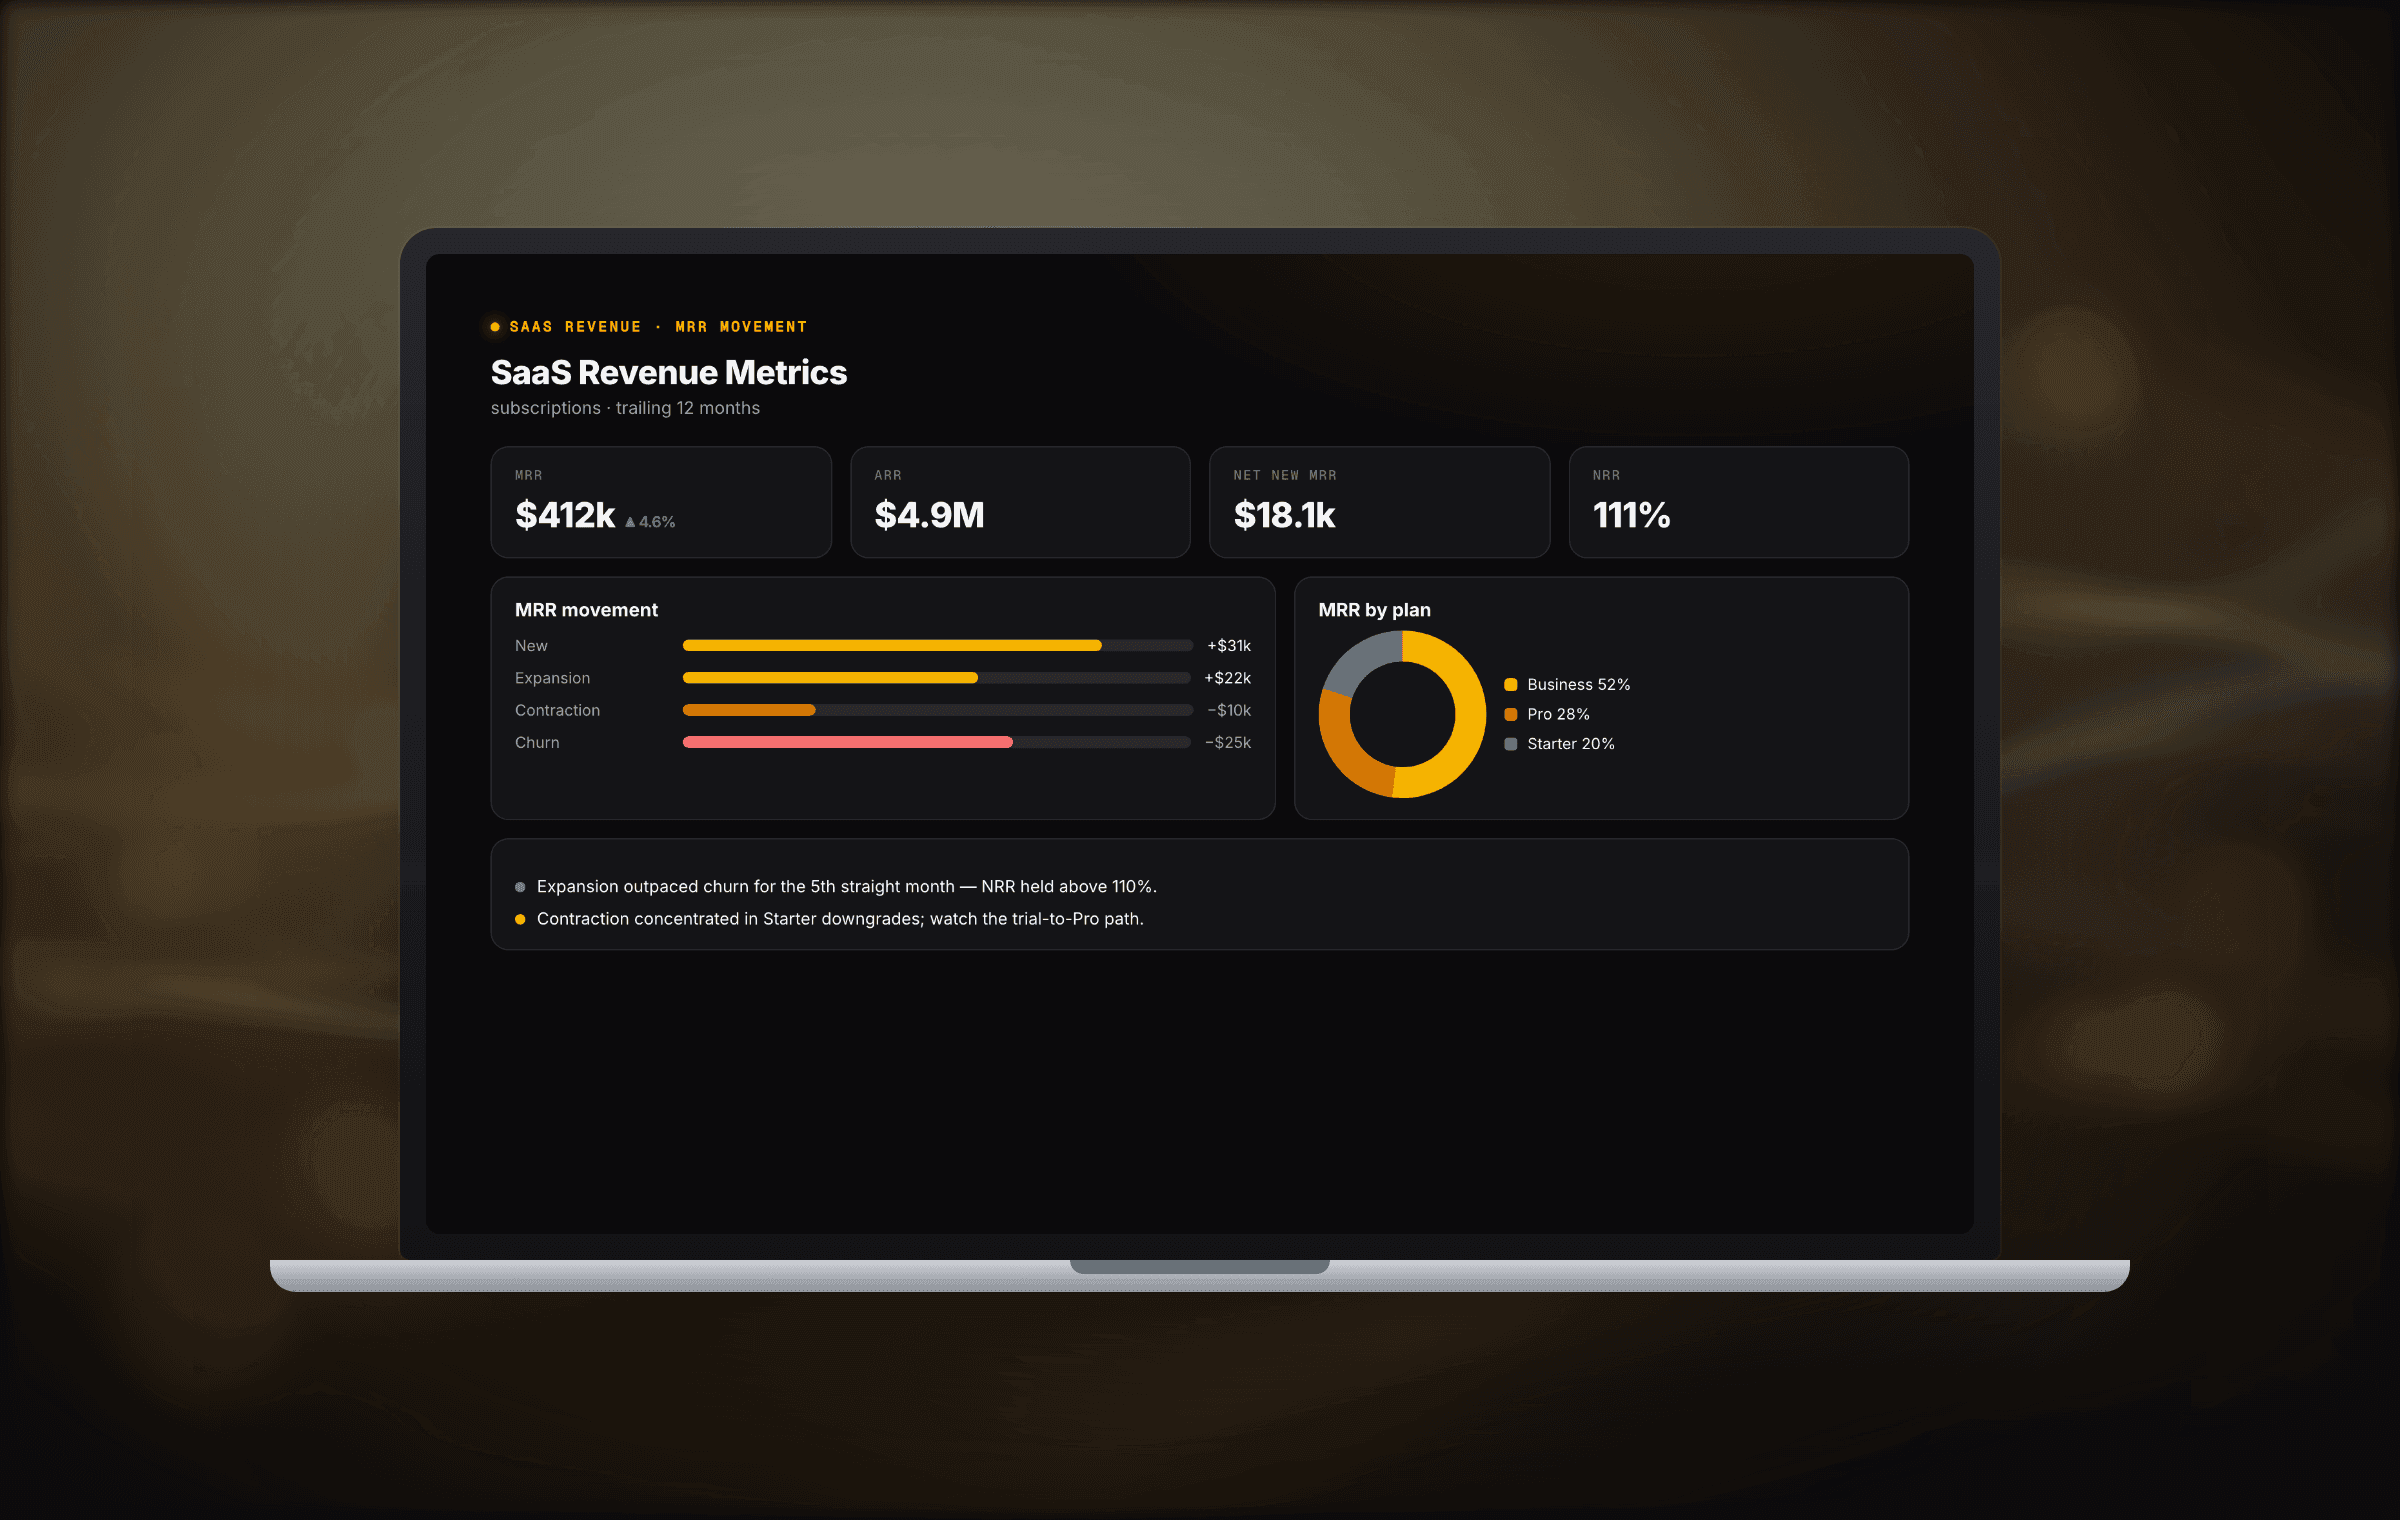
SaaS revenue metrics
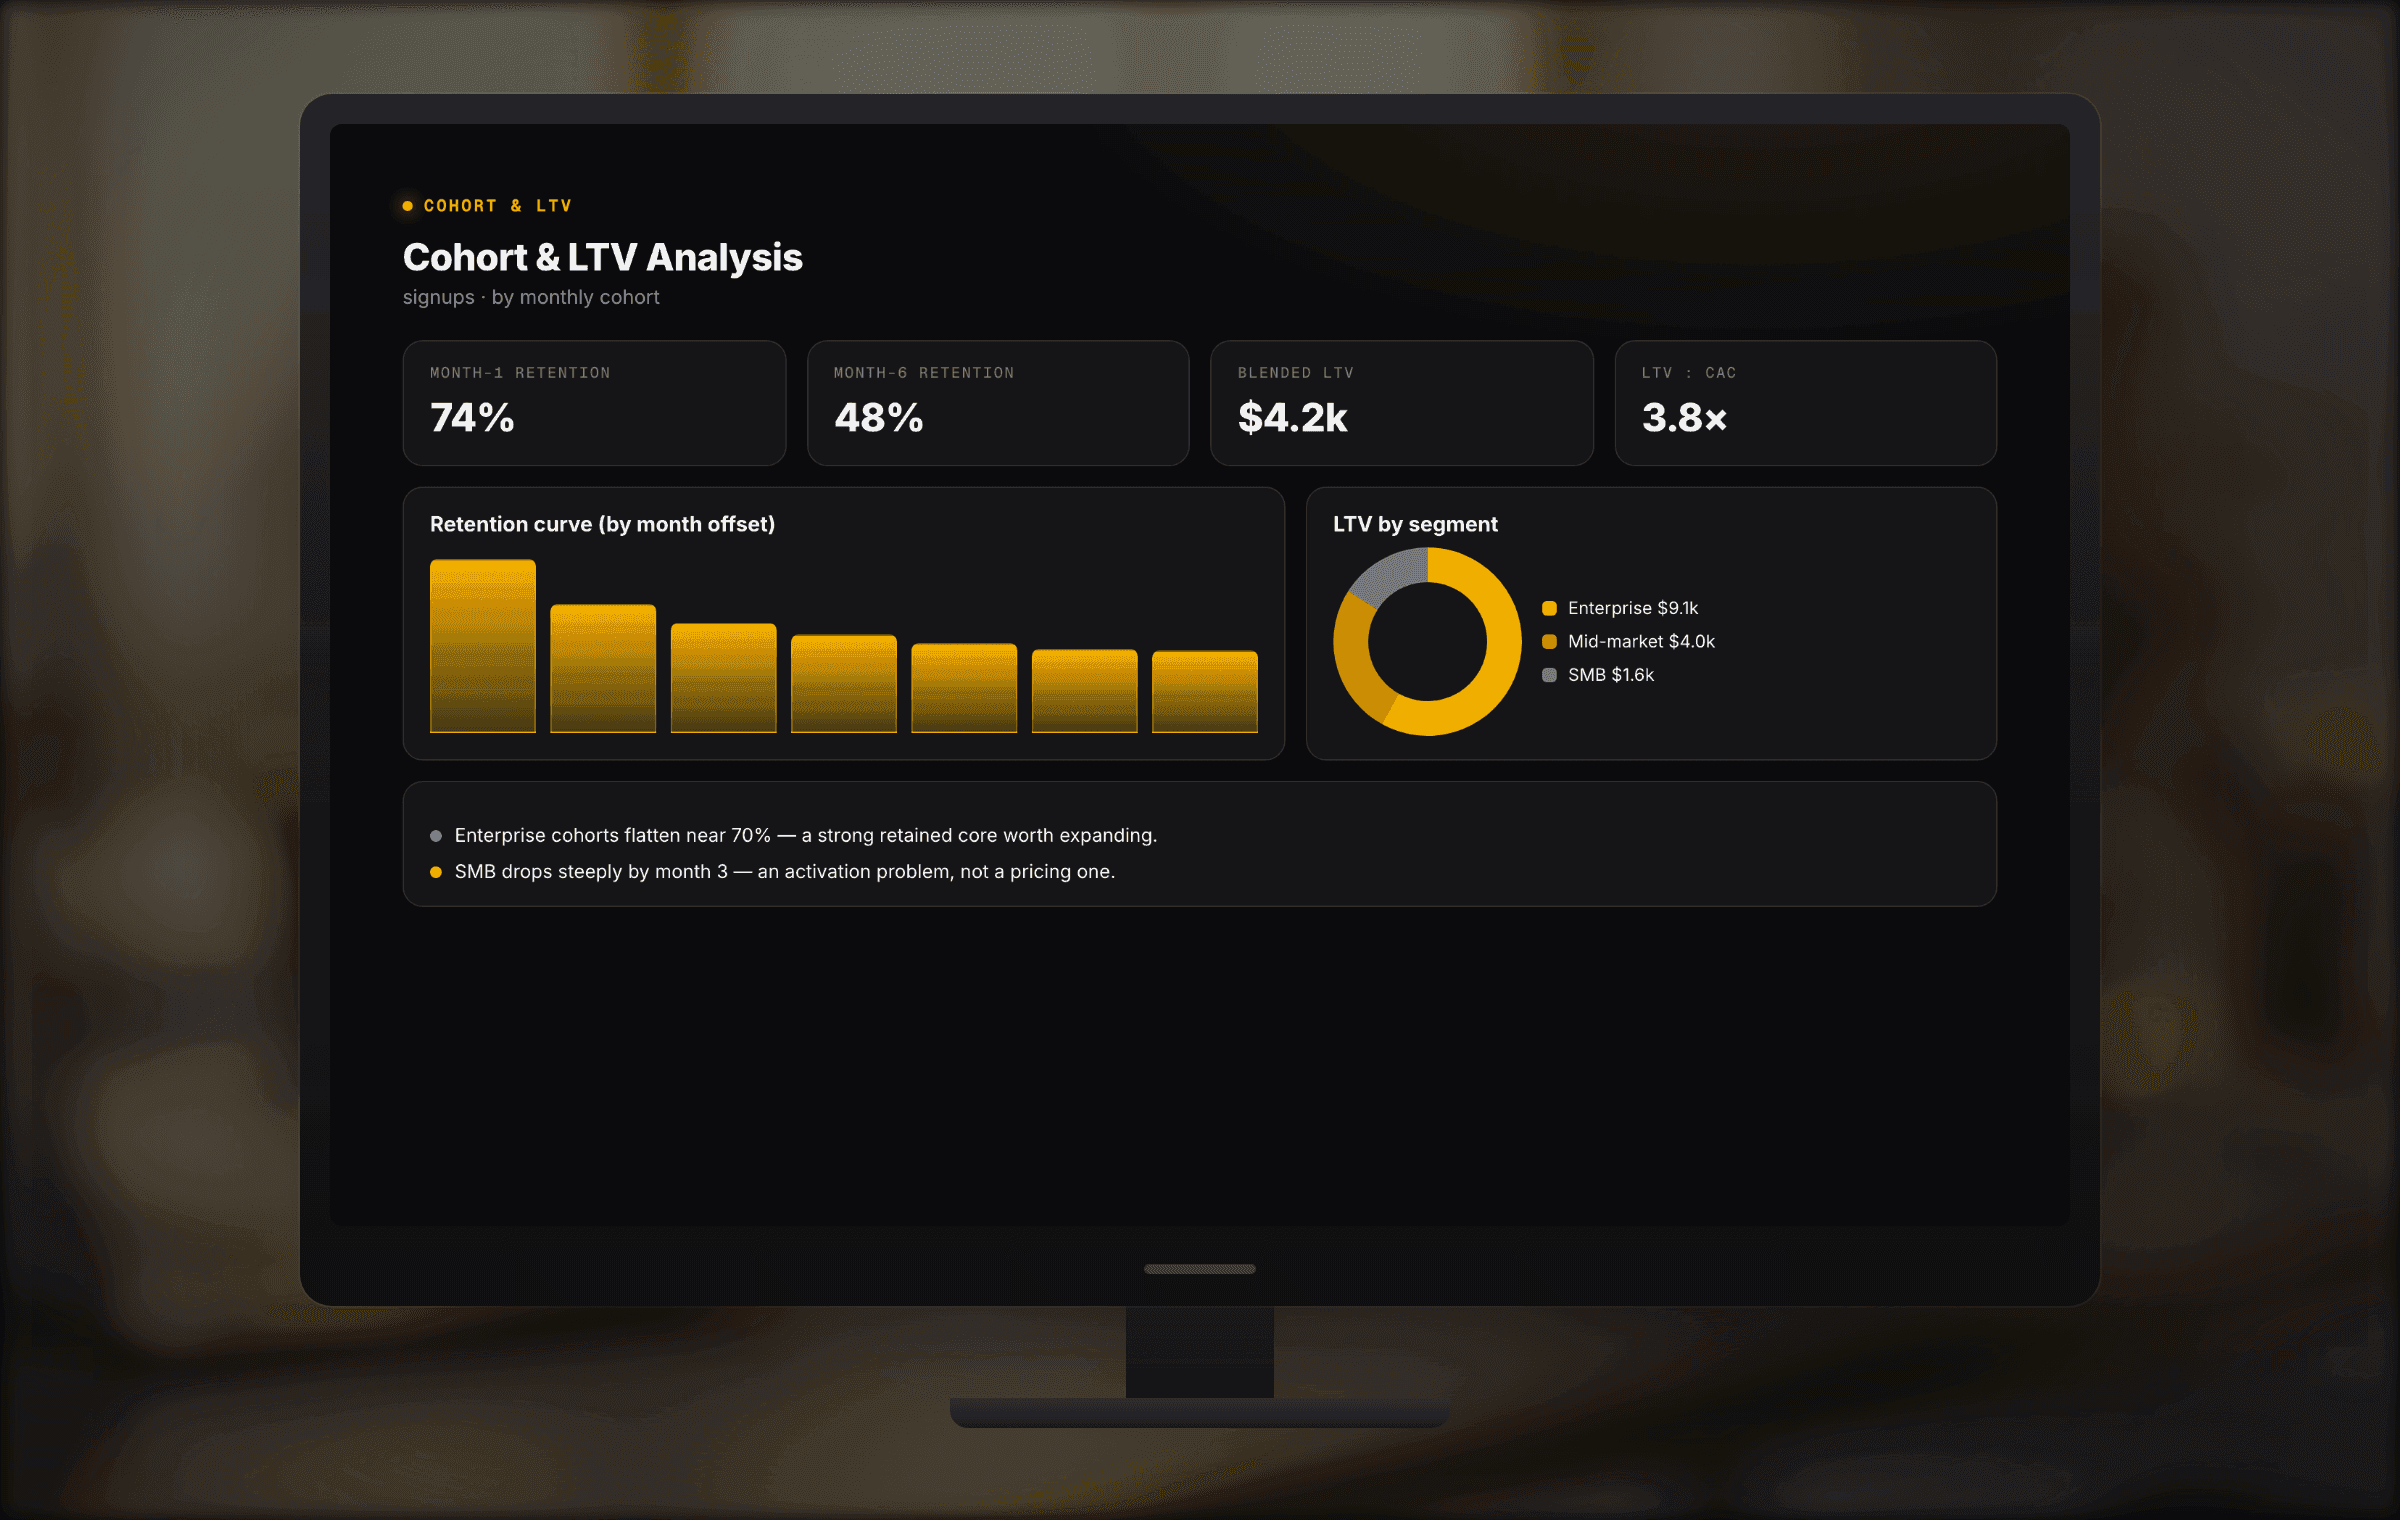
Cohort & LTV
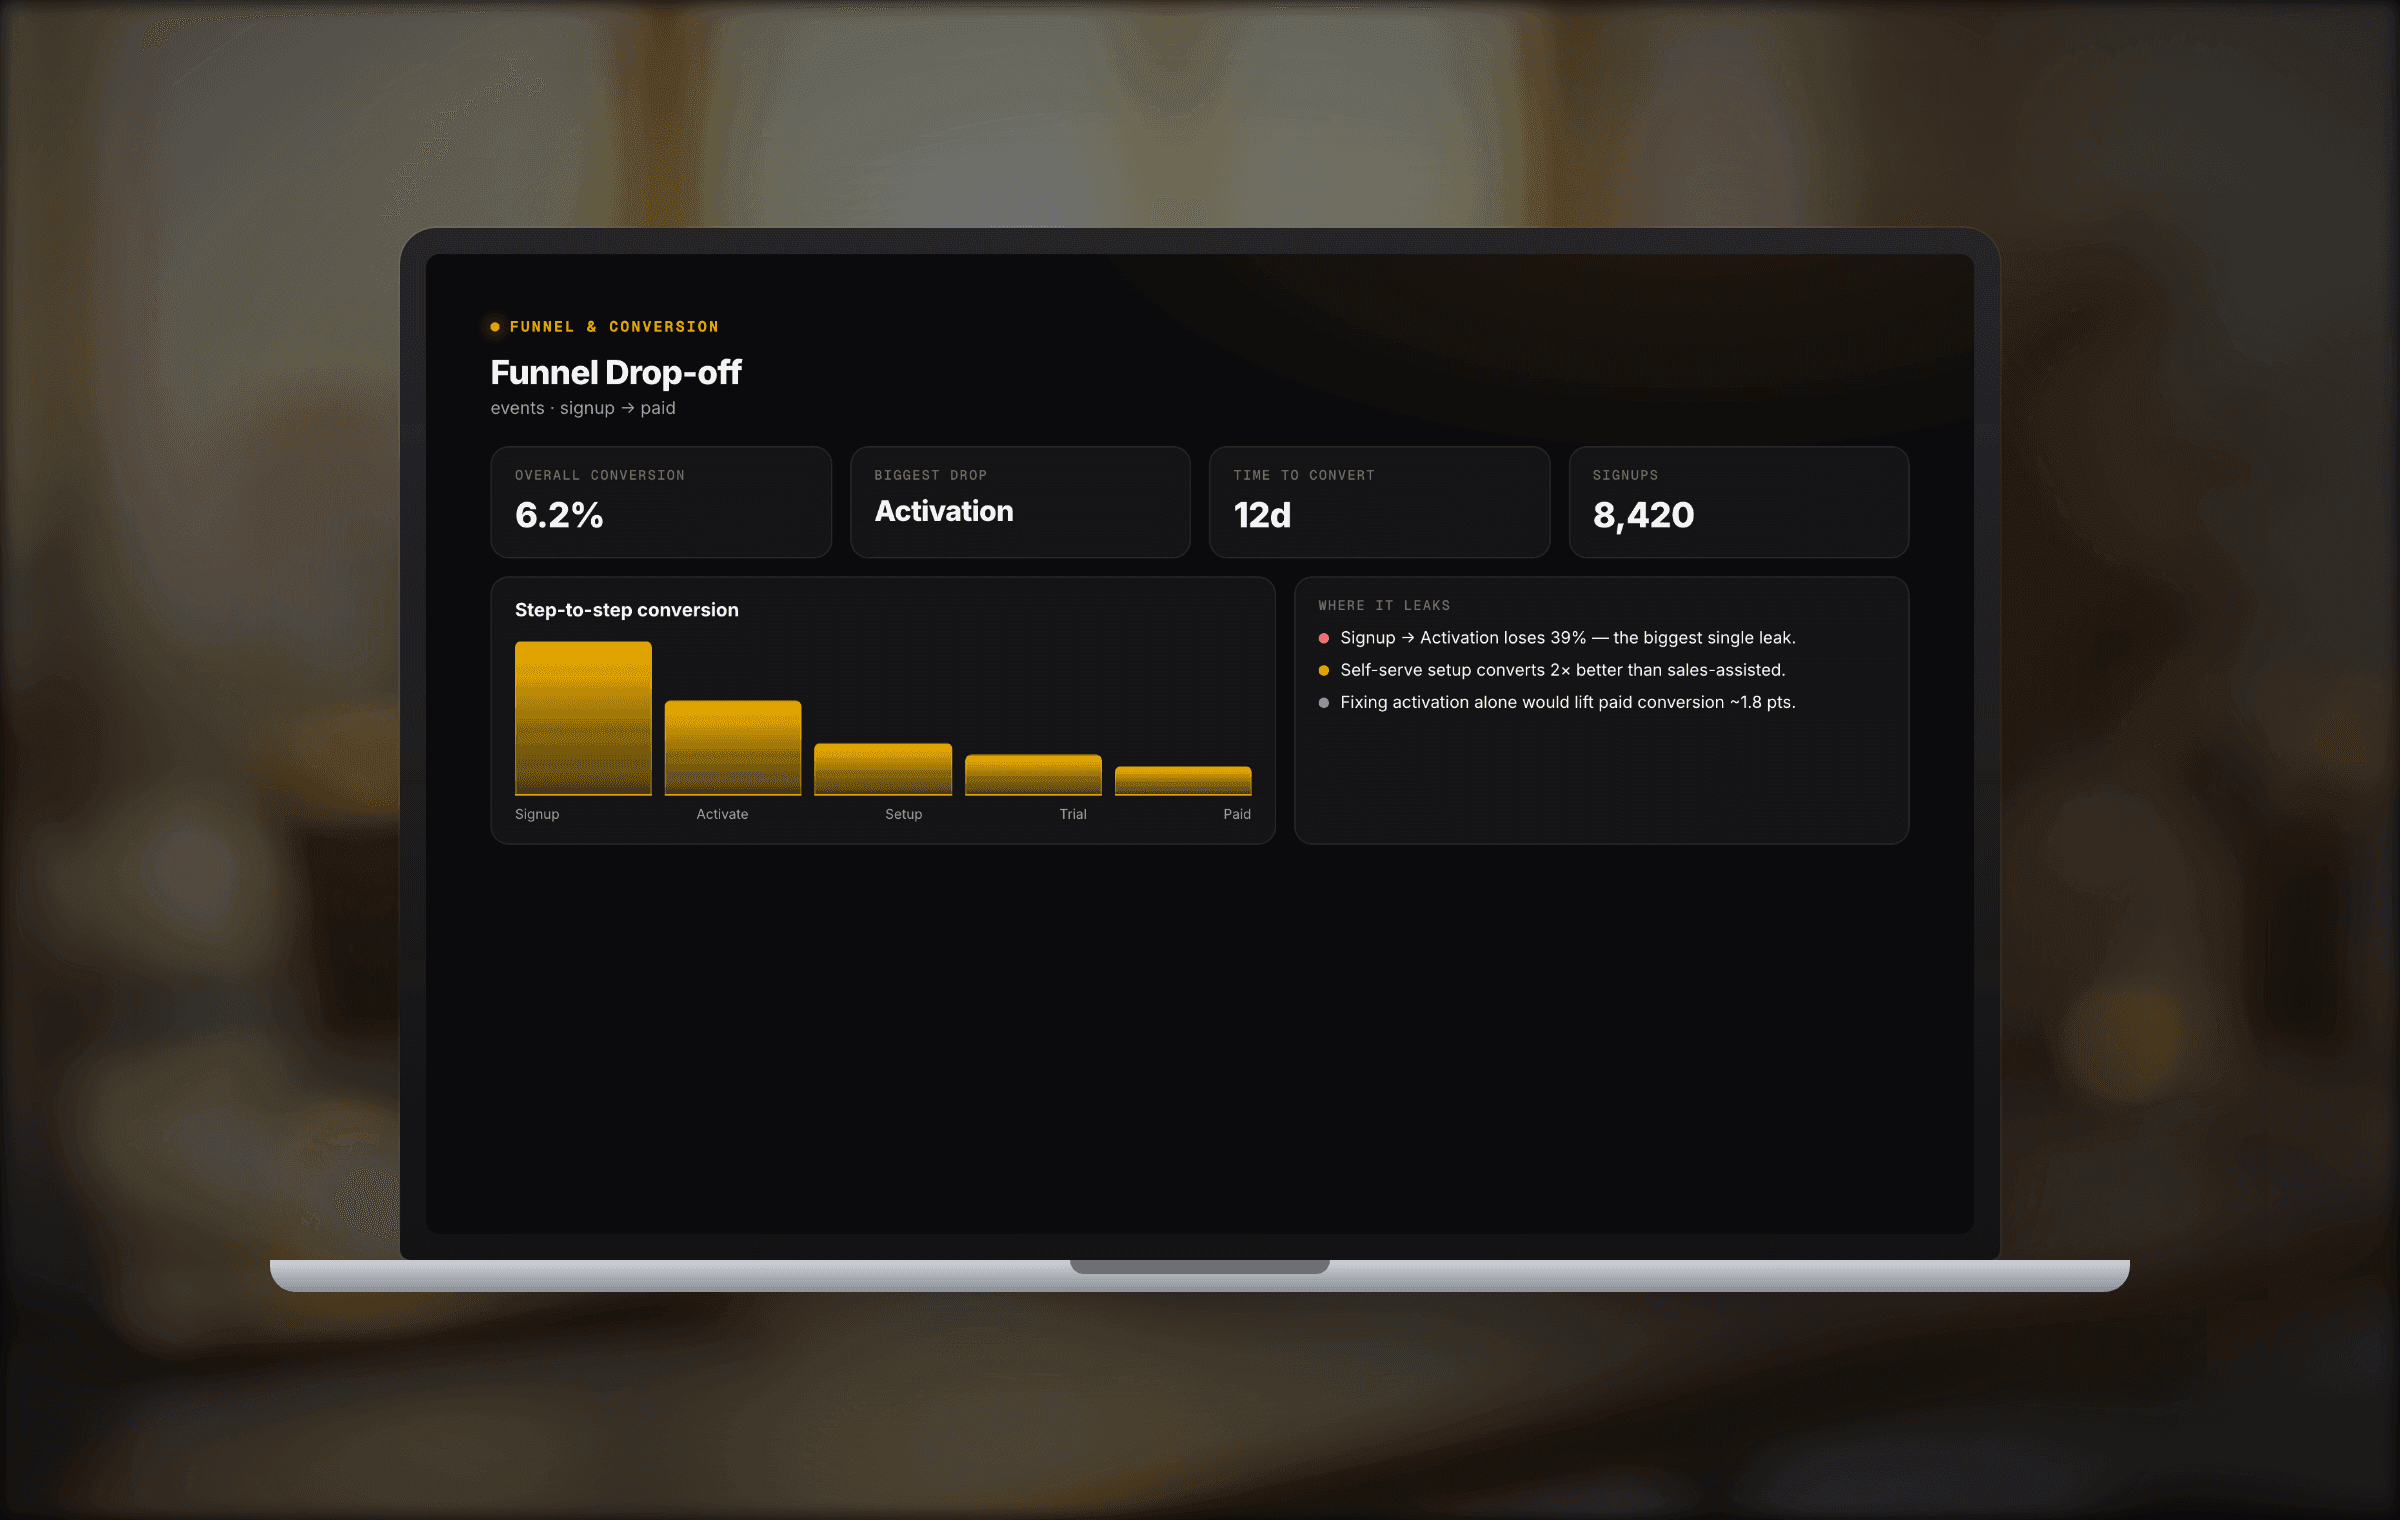
Funnel & conversion
Performance & decisions
The numbers leadership steers by.
Sales performance, marketing ROI, and a one-screen executive scorecard — the top-line KPIs with the deltas and the anomalies that matter.
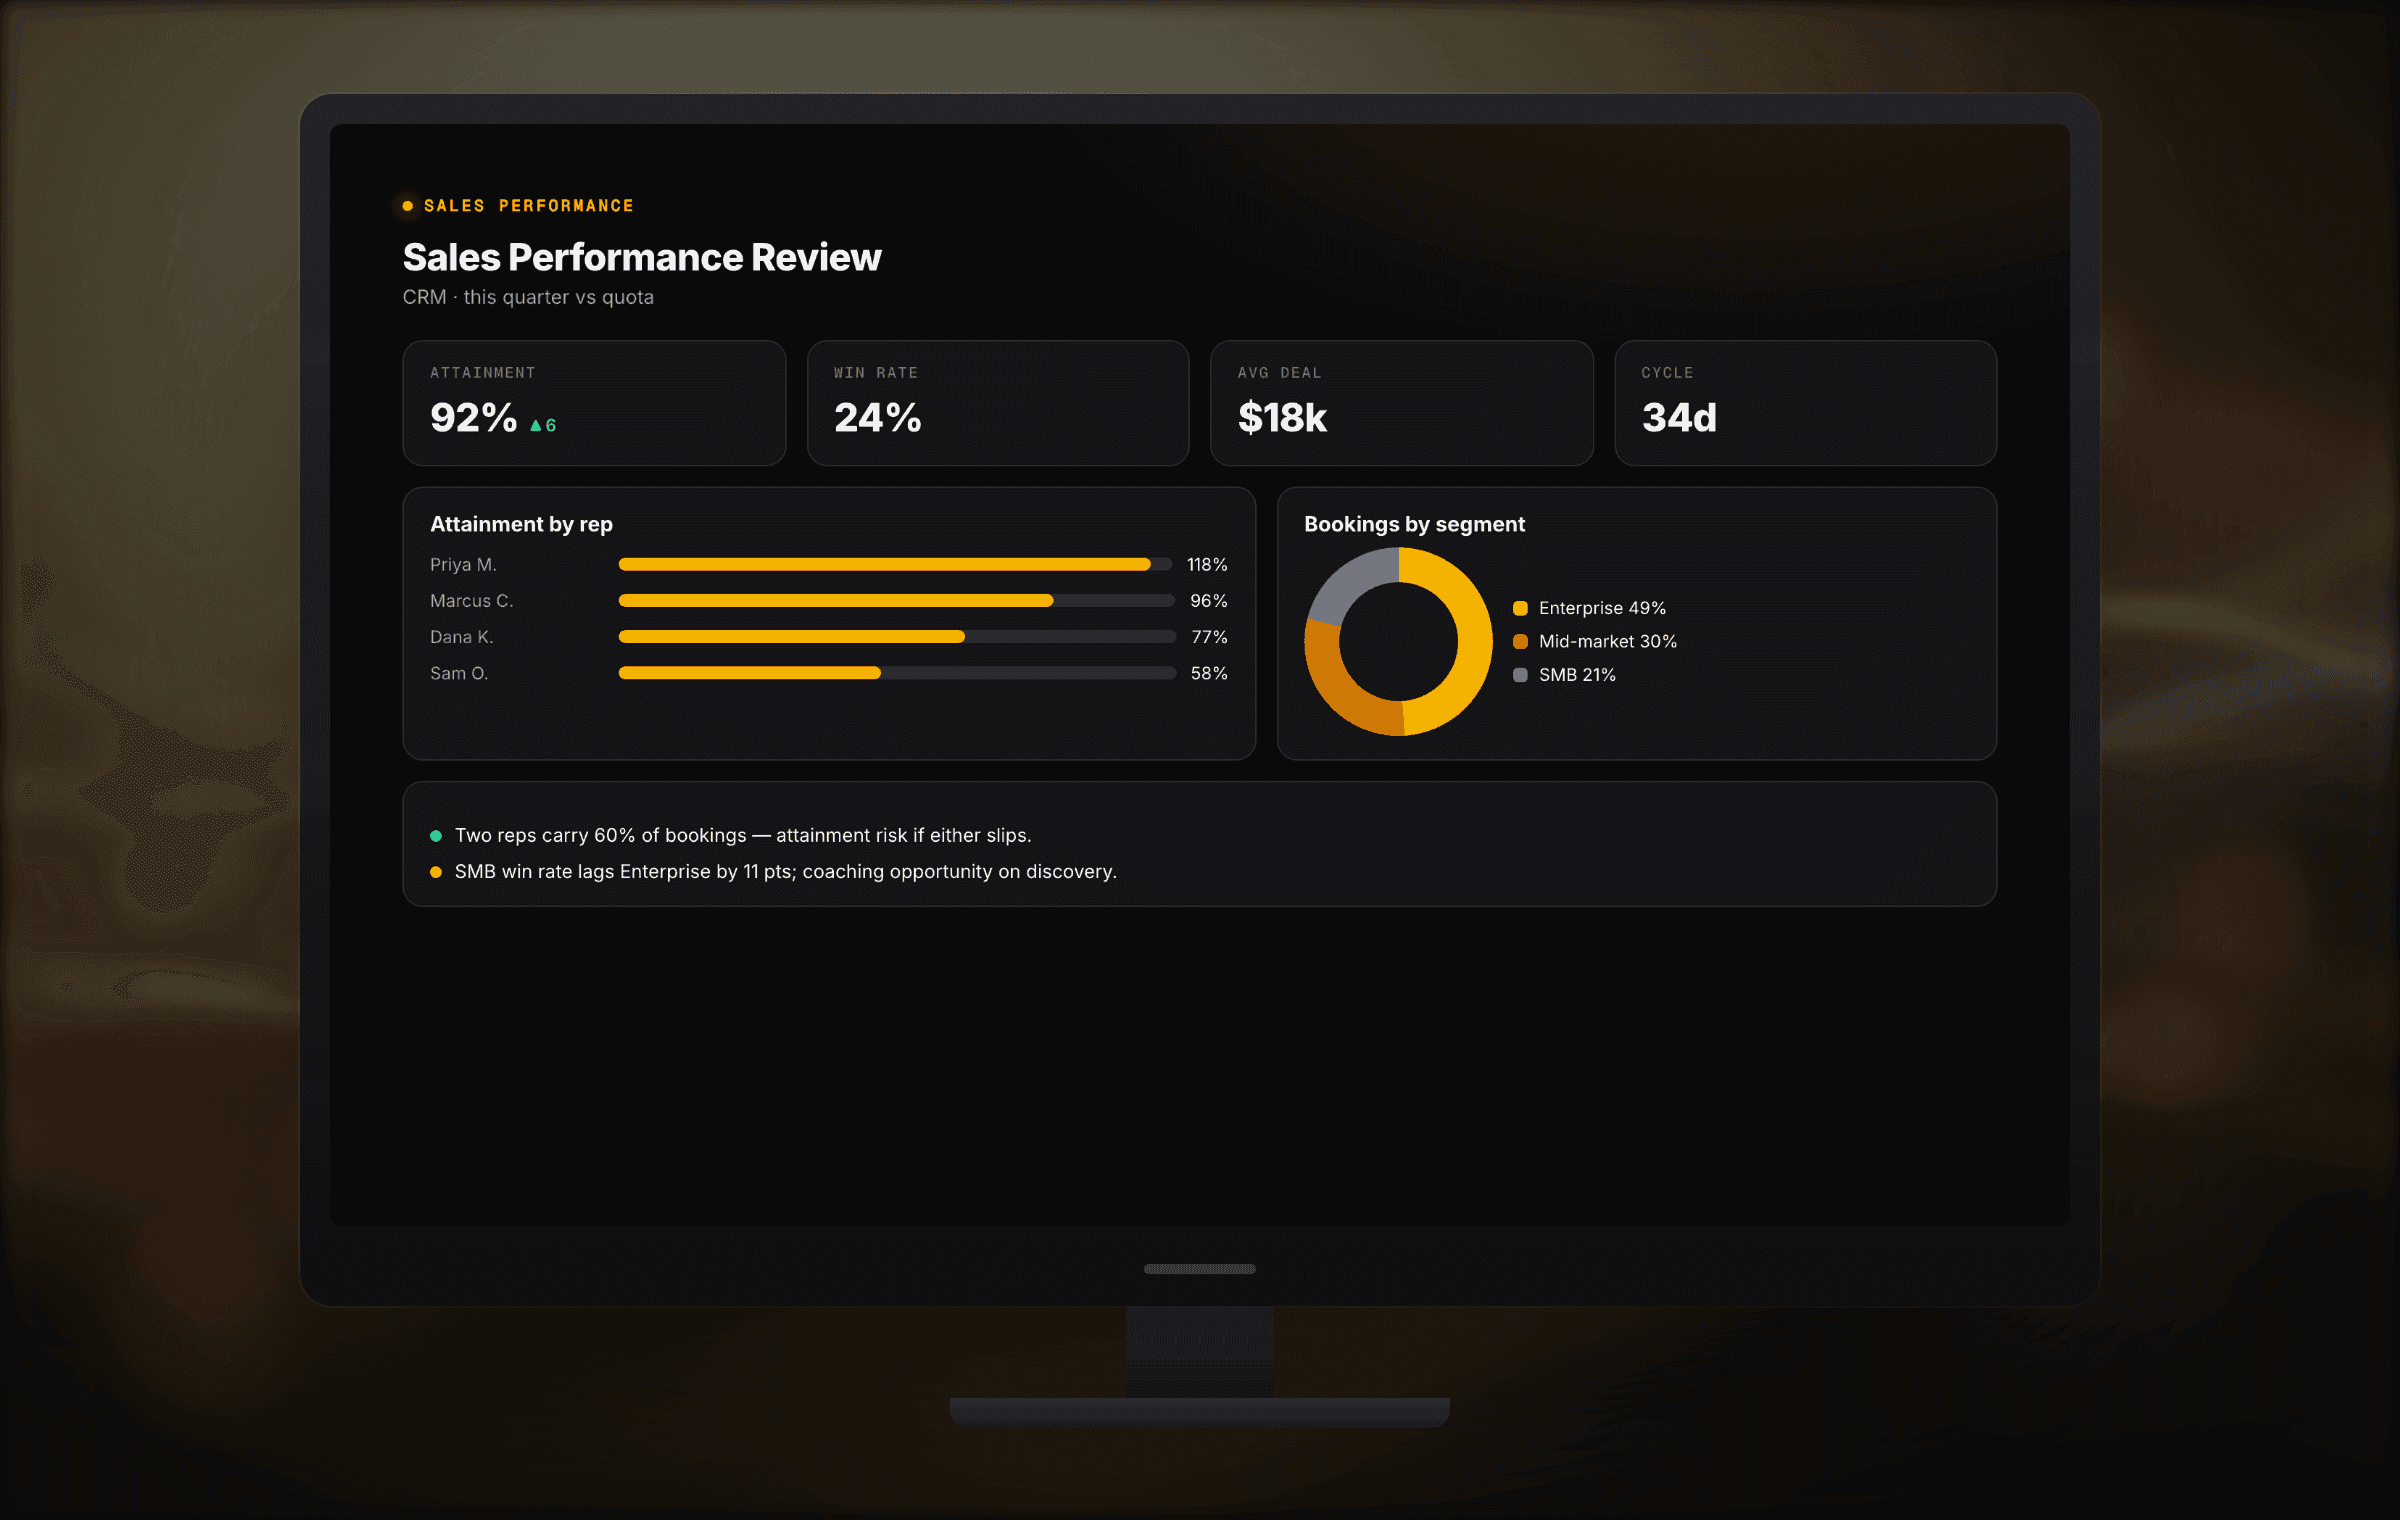
Sales performance

Marketing attribution

Executive KPI summary
Put the Data & Analytics Hive to work.
Describe what you need. The team takes it from there.
Get startedNext hive
Marketing Hive